Starting from release 3.23.01 the revenue is distributed among all participants in hierarchical manner. It allows calculations to be more precise, to manage the hold payout parameters and to tune the rates model depending on the payment flow.
This kind of model allows to redefine the rates as well as the hold amount and its payout date.
The order of revenue distribution for the sale transactions

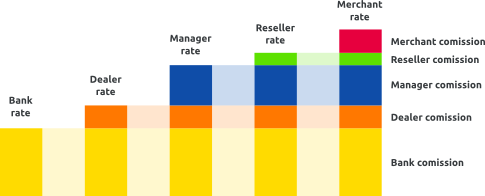
When an SMS or DMS transaction is processed all the participants withdraw their fee from the sale amount according to the rates defined. The rates applied from Bank to Merchant. Each participant in the flow can see only the rates defined for him without knowing the rates of preceding participants of the payment flow. For sale transactions the last participant is the Reseller and his rate will be the final one.
The order of revenue distribution for the transfer transactions

When the transfer transaction is being processed the rate calculation is the same, except for the additional participant – the money receiver. The last participant in this flow is the Merchant, and the receiver sees his rate as final

The first element on the diagram is the total commission accounted for the transaction. For the sake of simplicity we will examine sale transaction on the Project without Reseller. Thus the Merchant was deducted the commission defined in Manager’s rate plan. In this case the commission calculation goes throw the priority flow Bank → Dealer → Manager. That means that the Bank is the first to get its share according to the Bank’s rate, then the Dealer’s commission will be deducted and the Manager takes the rest.
There is a probability that the commission would not match the expected one.
Example 1:
Let’s see how the calculation of the commission would change depending on the ranges applied.
- The Dealer’s rate plan is denied as follows: if the transaction amount is between 0 and 1000 USD, the Dealer’s rate is 5 USD, if greater than 1000 USD – 8 USD;
- The Manager’s rate is fixed: 10 USD;
Let’s assume that the Manager didn`t notice the ranges defined by the Dealer and expects the commission of 5 USD
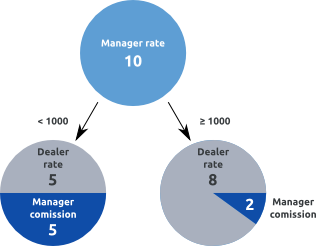
As you can see on the picture the Dealer’s commission is calculated before Manager’s and the actual Manager’s commission will be lower the expected – 2 USD.
Example 2:
You should be much more careful with the rates defined for BIN, country or bank Let’s assume that the Dealer’s and Manager’s ranges are the same.
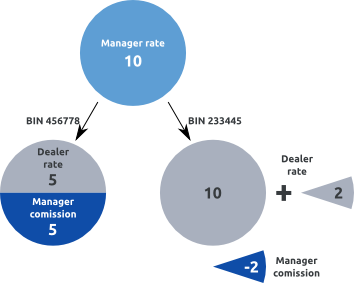
- Dealer’s rate: for all the transactions 5 USD, except for BIN 233445 which has the rate of 12 USD;
- Manager’s rate: let’s assume that the Manager’s didn’t take into account the Dealer’s rate for the BIN and defined the fix rate of 10 USD.
Let’s examine the transaction with the BIN 456778. The total commission will be distributed in the following way: 5 USD for the Dealer, 5 USD for the Manager.; The transaction with the BIN 233445 makes 12 USD for the Dealer and the Manager’s commission will be negative: -2 USD, because the total commission in the Manager’s rate plan is 10 USD.
In order to insure the risks carried by the Merchant it is possible to define the hold for particular Merchants. The payout management system provides the accounting of frozen holds and the amount of holds that are due to be paid back to the Merchant. The hold covers the risks related to chargebacks initiated by unhappy customers in case the contract with the Merchant was canceled. The carryover operation is accomplished during no more than 182 calendar days. The payment period as well as the hold percentage is defined in the rates.
The algorithm of the hold calculation and carryover
Every participant of the payment flow, except for the Merchant, can define his own the hold percentage and the hold period. The hold percentage and hold period do not depend on each other.

According to the figure, for the transaction t1 the Bank withdraws from the value of HB from the total commission for the period of ΔtB, defined in the Bank’s rate. Thus the Bank holds the amount of HB for the period [t1, t2] on its account to cover the risks of chargeback and fraud operations. After ΔtB period has expired, in case the were no negative transactions the Bank pays out the hold back to the Dealer. This process CB is known as carryover. The same flow is applied to any participant of the payment flow.
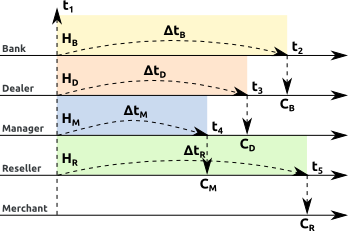
The total earnings of any participant is: commission + hold of the participant – hold of preceding participant.
- For the Bank: in the moment t1 for the period ΔtB the earnings will be topped up by the amount of the hold HB, in the moment t2 will be deducted the same amount;
- For the Dealer: in the moment t1 for the period ΔtD the earnings will be topped up by the amount of the hold HD, in the moment t3 will be deducted the same amount, in the moment t2 the Dealer’s earnings are topped up by the amount of the carryover CB paid back by the Bank
- For the Manager: in the moment t1 for the period ΔtM the earnings will be topped up by the amount of the hold HM, in the moment t4 will be deducted the same amount, in the moment t3 the Manager’s earnings are topped up by the amount of the carryover CD paid back by the Dealer
- For the Reseller: in the moment t1 for the period ΔtR the earnings will be topped up by the amount of the hold HR, in the moment t5 will be deducted the same amount, in the moment t4 the Reseller’s earnings are topped up by the amount of the carryover CM paid back by the Manager
- For the Merchant: the Merchant cannot define the hold values, in the moment t1 for the period ΔtR the earnings will be deducted the amount of the hold HR, in the moment t5 will be topped up by the same amount
If you define the hold parameters in the correct way the hold percentage of the payment flow participant is not less than the hold percentage of the preceding participant. Otherwise it leads to financial risks. The same is true for the hold period parameter.
To get the better flexibility to define the rates you can use rate table definition user interface.
For the types of transactions that initiate the orders, except for the transfer, the single level range rates table is supported. The range can be defined for: transaction amount, total amount and total number of the transactions processed by the Gate for the current month.
For the transactions that do not initiate orders you can define the following ranges: the ratio of the current number of transactions of this type to the total number of the transactions for the current or past month.
For transfer transactions you can define two levels of ranges in the rates table. The first level ranges are the same as for the transaction that initiate orders. The second level is the transfer direction. The transfer directions are defined at the Industra instance level. The standard directions are: from Visa card to any other card, from MasterCard card to any other card, the transfer within the bank and a lot of others. To select the desired directions, please, create an enhancement request.
 The calculation of the aggregated amounts(total amount, total number and ratio) is accomplished by default at the Gate level. In order to insure the rates transparency you should select the calculation of the aggregated amounts at the Endpoint or Project level.
Let’s examine the rates table configuration for the transfer transactions
Let’s assume that the Gate supports transfers for various types of cards. The rate of the transfer depends on the total amount of the transactions processed by the Gate. The limit is set to 10 000 000. You can define different rates depending on the transfer direction. If the total amount is less than 10 000 000 the rates for the following directions are applied:Visa2Any, MasterCard2Any, Any2Any, otherwise the common rate is set. In this case we have the following hierarchy:
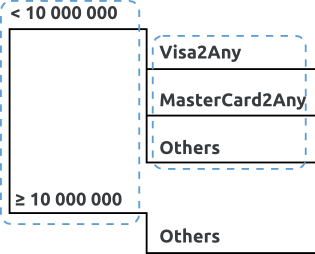
Let’s examine the flow of a transaction made with the card 4444 5555 6666 1111. Since the first level ranges are defined for the total transactions amount first the total amount of the transactions processed by the Gate is examined at the time of transaction processing. Assume that the total amount is 5 000 000, that means the flow goes via the upper branch. Next, the rage for the card type is defined, the card being processed is Visa. For Visa cards there’s a transfer direction Visa2Any. It means the system will pick the rate in the table: < 10 000 000, Visa2Any.
 It might happen the the card will fall into several directions at the same time. In this case the direction is selected in the following priority: the transfer within a bank, then the direction where both sender and receiver are defined (e.g. Visa2Visa), then the direction where only the sender is defined (e.g. Visa2Any), the direction where only the receiver is defined(e.g. Any2Visa), default direction.
You are allowed to define the ranges for directions as the first level of hierarchy. In this case when you define the rates table, the amount and number of the transactions will be calculated for all directions separately.
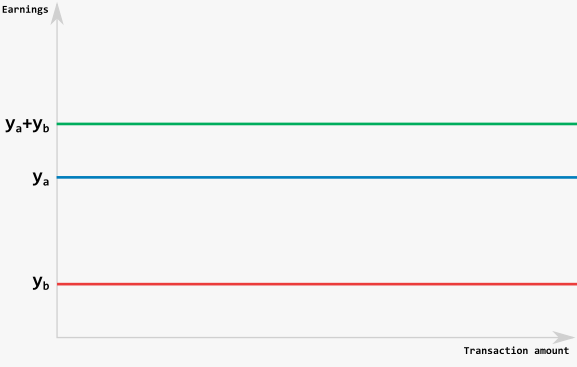
To define the rate plan correctly you have to understand how you can make it for different participants of the payment flow. Let’s first examine simple cases. Let’s say the commission of the participants A and B is defined solely by the minimal value and doesn’t depend on transaction amount. The participant A expects the earnings ya, the participant B – yb. In such a case you have to define the rate plan with the minimal rate of ya+yb.
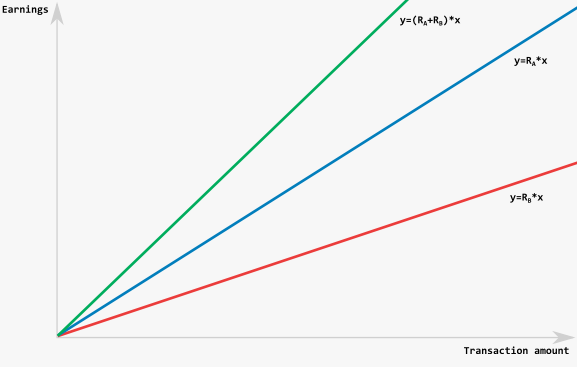
The same logic is applied for the rates with defined percentage rate only. Let’s assume the commission of the participants A and B is only defined as a percentage of the transaction amount. The participant A expects the commission Ra, the participant B – Rb. In such a case you have to define the rate plan with the commission set to Ra+Rb.
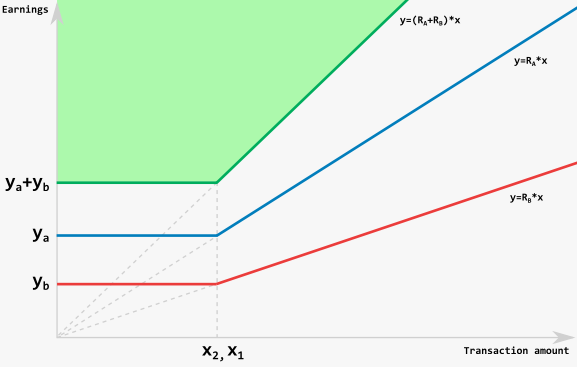
Let’s examine a more complex case. Assume that both participants expect the commission as a minimal value for transactions less than certain amount and the percentage of the transaction otherwise. The threshold to switch from the minimal rate to percentage rate for the participant A is x1, for the participant B – x2. If this threshold is the same for both participants (x1 = x2), then the applied rate will be the sum of the minimal rates below the threshold and the sum of the percentage amounts above it.
If the parameters are different the rate is calculated in a more complex way. Let’s visualize the possible cases.
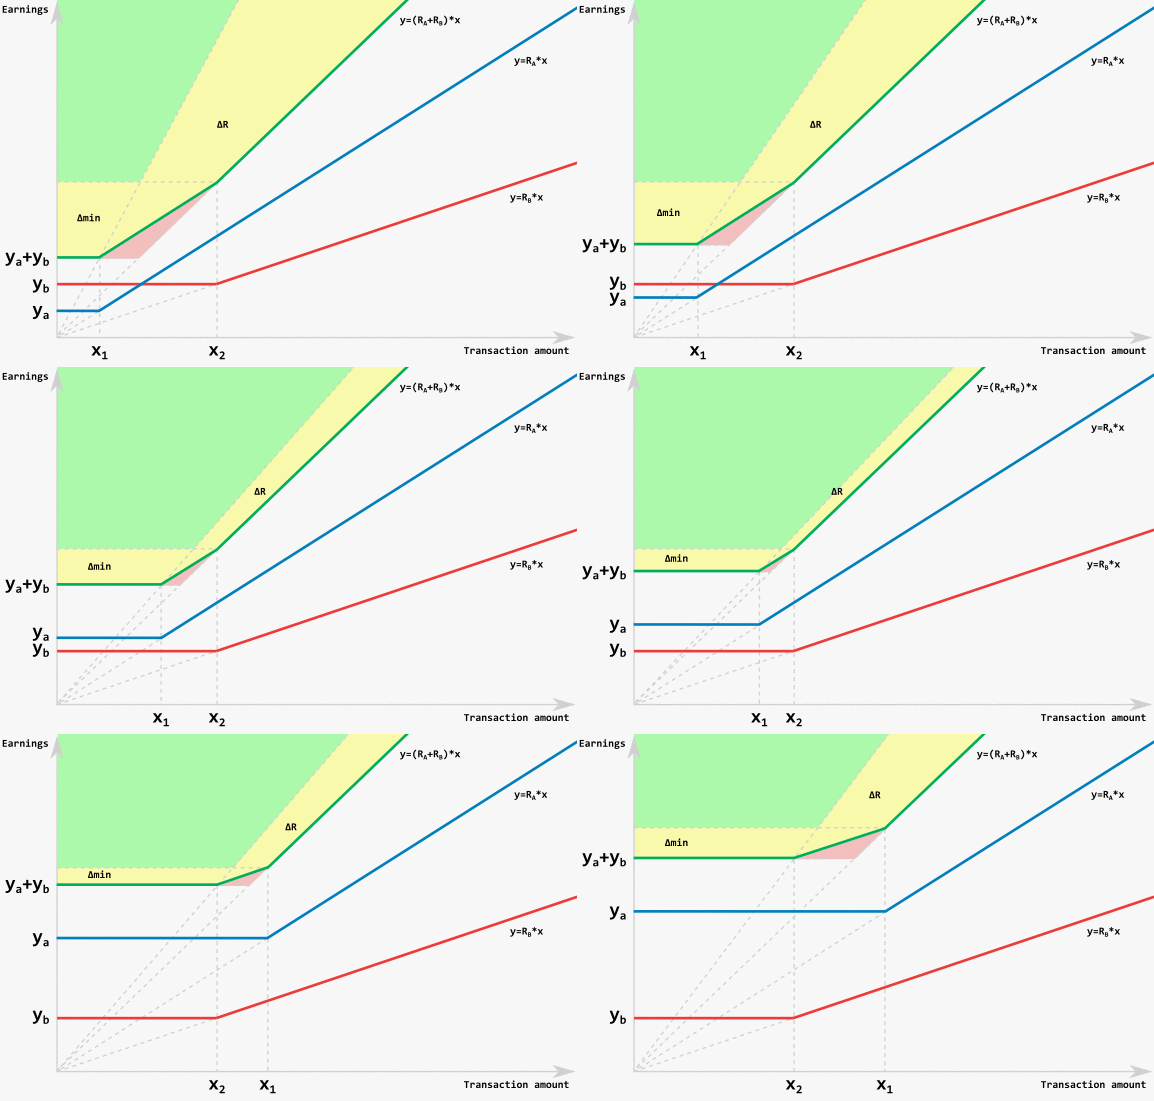
On the figure the minimal possible rate is marked green. In the range (x1, x2) the rate is defined by another formula than just the sum of two minimal rates and the sum of the percentage rates. It’s not possible to correctly define such a rate in a precise manner. You have to add the two ranges: x1, x2. In (0, x2] the rate is defined as a sum of minimal commissions. In [x1, x2] the rate is defined as a percentage rate of the participant A (or the participant B if his threshold triggers first) and the absolute value of the participant B’s commission which is equal to the minimal commission of the participant B (or A vise versa). In [x2, +∞) the rate is defined as the sum of the percentage rates of the both participants.
In order to avoid too complex rates tables you have to adjust the minimal rate value as well as the percentage. If you increase the minimal rate in the range Δmin you have to increase the percentage rate ΔR as well. If you adjust the minimal rate value by more than Δmin amount you should not adjust the percentage rates. The adjustment bounds are marked with dotted line.
If you ignore these adjustments for the transactions amounts that fall into (x1, x2), the commission for the participant B will be lowered (assume that B is lower in the payment flow hierarchy).




 The calculation of the aggregated amounts(total amount, total number and ratio) is accomplished by default at the Gate level. In order to insure the rates transparency you should select the calculation of the aggregated amounts at the Endpoint or Project level.
 It might happen the the card will fall into several directions at the same time. In this case the direction is selected in the following priority: the transfer within a bank, then the direction where both sender and receiver are defined (e.g. Visa2Visa), then the direction where only the sender is defined (e.g. Visa2Any), the direction where only the receiver is defined(e.g. Any2Visa), default direction.


